Get Found Online
Build a Website
AI Systems
How It Works
Proof & Results
Pricing
Resources
About / Contact
Get my free visibility check
Real client results

SEO results from Vyntra SEO OS. Real Search Console data.

Every chart on this page is a real Google Search Console screenshot from a client site. We hid the names and added arrows so you can see the moment the line turned.

Quick answer

What results does Vyntra SEO OS get? On the client sites shown here, the pattern repeats: a flat line in Search Console, then sustained growth once Vyntra SEO OS is running. One site went from almost no clicks to about 550 a day within five weeks. Another went from about 150 to over 700 clicks a day in four weeks. A third is cited in 190 AI answers, including 184 Google AI Overviews. Results vary by site, and we never guarantee rankings.

How the line turns

The same shape, again and again.

Look at the charts on this page and you'll see one shape repeat: a flat line, then a turn upwards that holds. That turn isn't luck. It's what happens when SEO stops being a monthly checklist and becomes a system that works every day.

01

Record the flat line.

We connect Search Console and log where the site starts: clicks, impressions, positions and indexed pages. That flat line is the "before" in every chart below.

Index agent · Rank agent
02

Remove what blocks Google.

The Technical agent crawls the site like Googlebot, and the Index agent finds pages Google has dropped. Each fix is proposed, and a person approves it before anything changes.

Technical agent · Index agent · human review
03

Build what people search for.

The On-page agent drafts titles, headings, internal links and missing content. The Competitor agent watches who is winning each query and why.

On-page agent · Competitor agent
04

Let it compound.

The Rank agent tracks positions every day, and the Report agent explains every movement in plain language. The cycle repeats every week, so gains stack up instead of fading.

Rank agent · Report agent
Real screenshots

The proof, client by client.

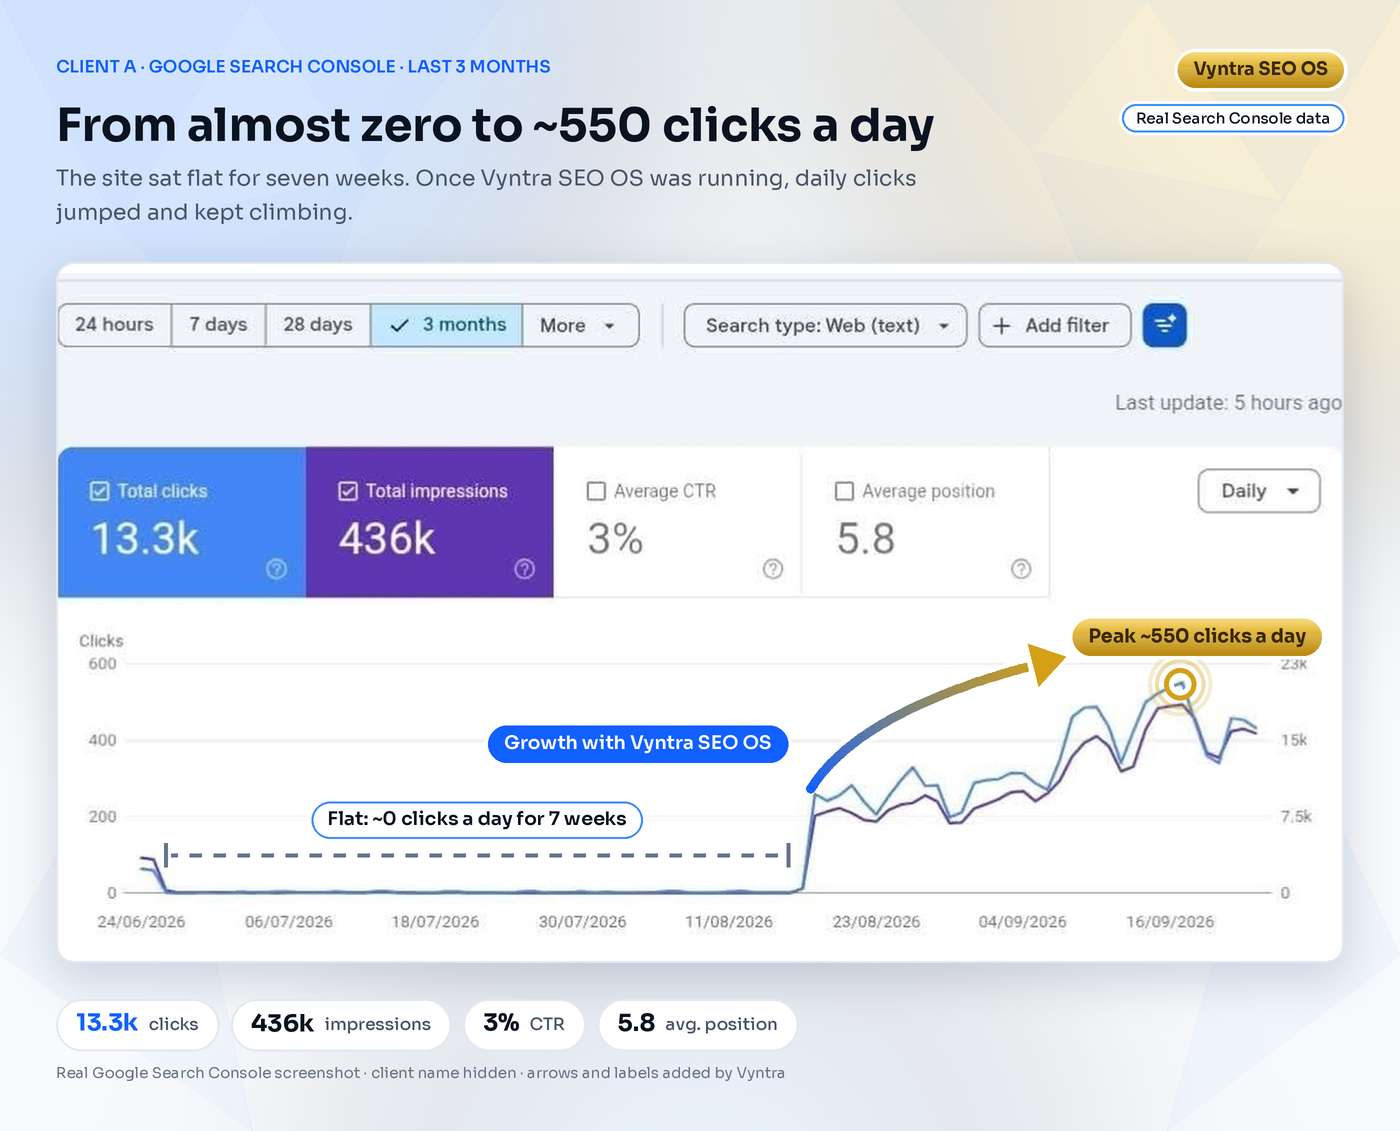
Google Search Console, 3 months: clicks flat near zero from late June to mid-August 2026, then rising to about 550 a day
Real Google Search Console screenshot · client name hidden · click to open full size
Client A · Search Console · last 3 months

From almost zero to ~550 clicks a day

What the chart shows

For seven weeks, from late June to mid-August 2026, the site got almost no clicks from Google. In mid-August clicks jumped to around 250 a day and kept climbing, peaking at about 550 a day in mid-September. Over the three months: 13.3k clicks and 436k impressions at an average position of 5.8. This is the shape we build for: a flat line that turns and keeps rising, rather than one spike.

  • 13.3k clicks
  • 436k impressions
  • 3% CTR
  • 5.8 avg. position
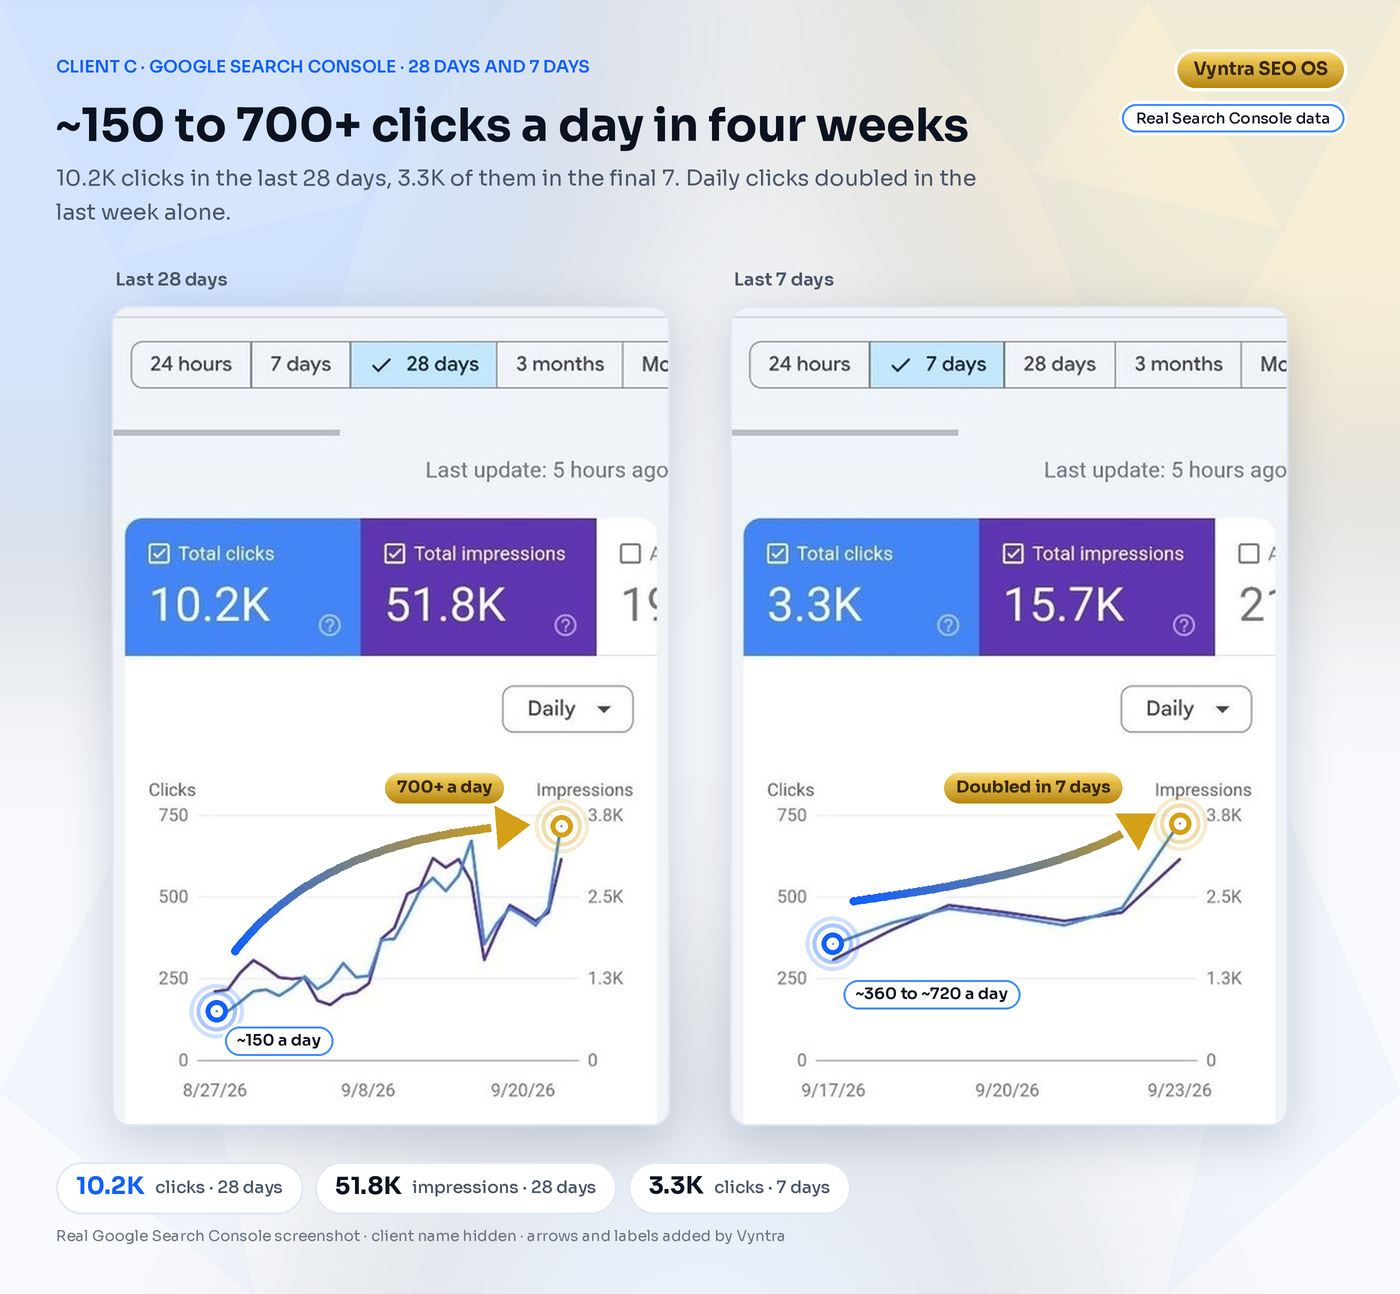
Google Search Console, 28 days and 7 days: daily clicks rising from about 150 to over 700
Real Google Search Console screenshot · client name hidden · click to open full size
Client C · Search Console · 28 days and 7 days

~150 to 700+ clicks a day in four weeks

What the chart shows

At the end of August the site was getting about 150 clicks a day. Four weeks later it passed 700. It earned 10.2K clicks and 51.8K impressions in the last 28 days, and 3.3K of those clicks came in the final seven days, when daily clicks doubled from about 360 to about 720.

  • 10.2K clicks (28 days)
  • 51.8K impressions (28 days)
  • 3.3K clicks (7 days)
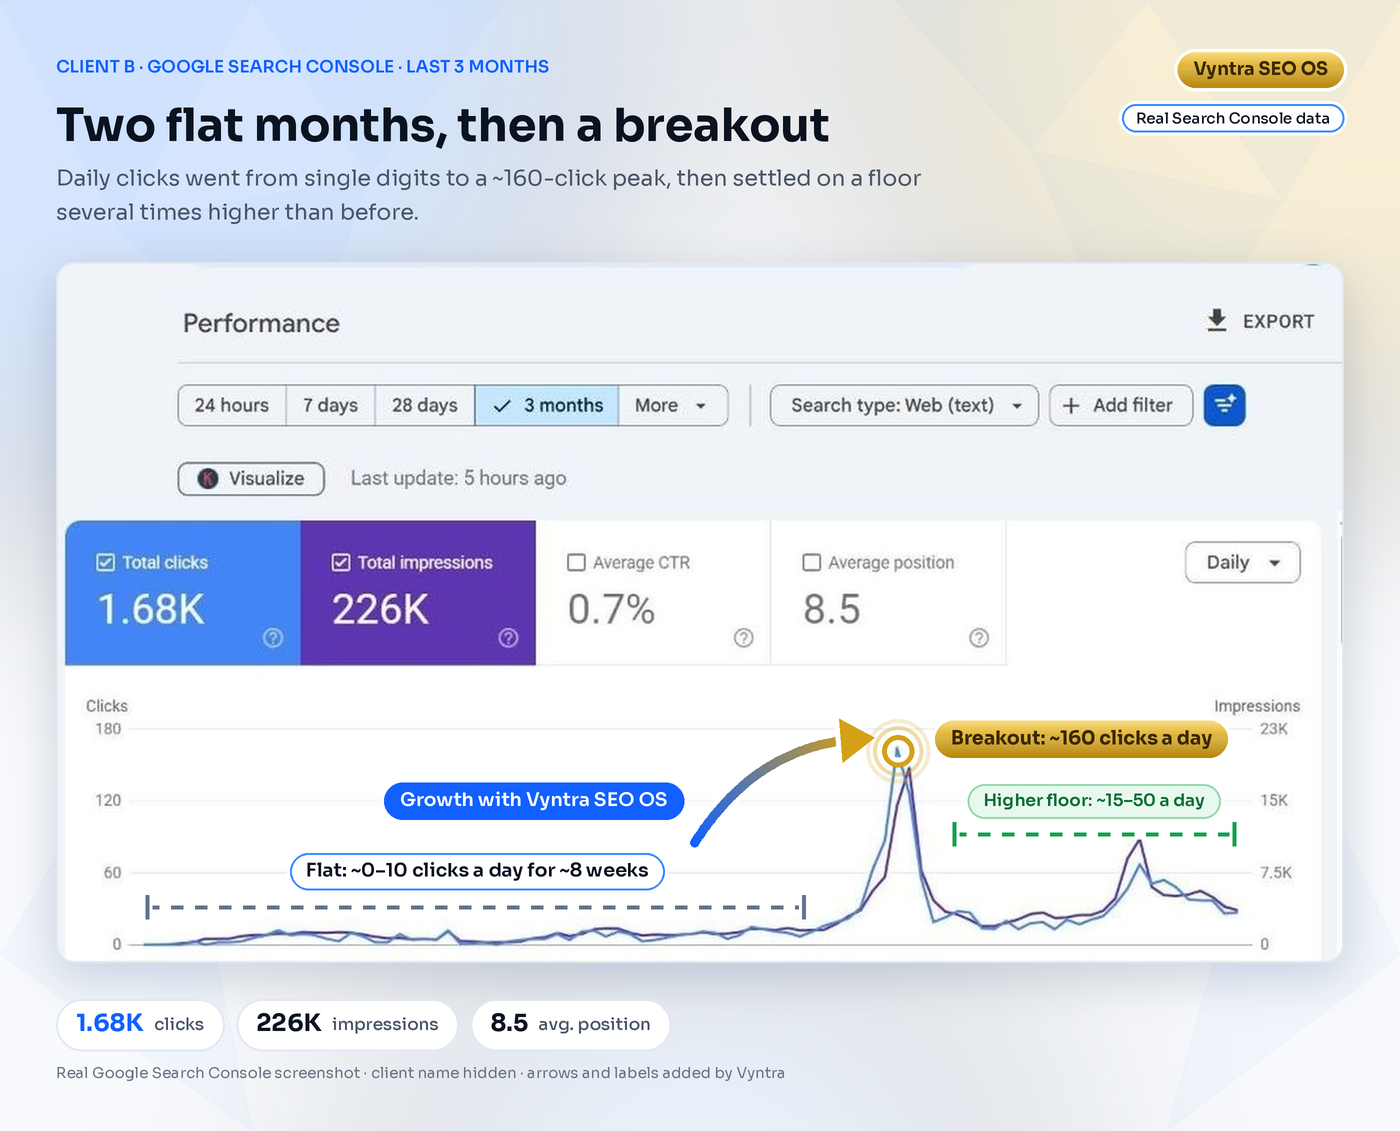
Google Search Console, 3 months: roughly 0–10 clicks a day for eight weeks, then a peak of about 160 a day and a higher floor after
Real Google Search Console screenshot · client name hidden · click to open full size
Client B · Search Console · last 3 months

Two flat months, then a breakout

What the chart shows

For about eight weeks the site earned roughly 0–10 clicks a day. Then visibility broke out: clicks peaked at about 160 a day and impressions at roughly 18K a day. After the peak the site settled on a new floor of roughly 15–50 clicks a day, several times higher than where it started. Totals: 1.68K clicks and 226K impressions at an average position of 8.5.

  • 1.68K clicks
  • 226K impressions
  • 8.5 avg. position
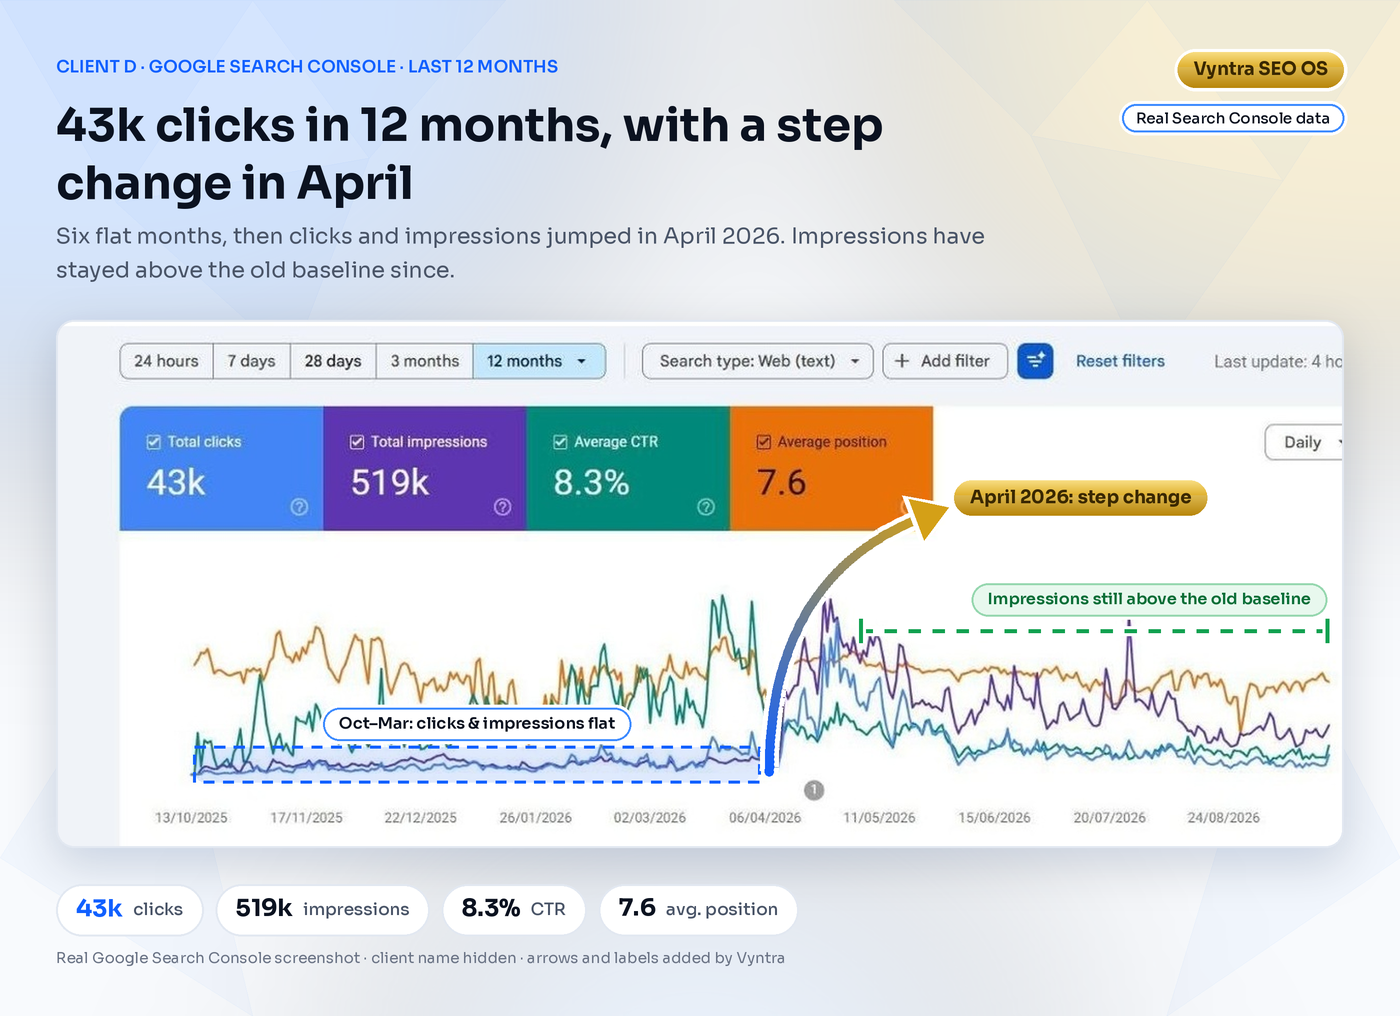
Google Search Console, 12 months: clicks and impressions flat from October 2025 to March 2026, then a step up in April 2026
Real Google Search Console screenshot · client name hidden · click to open full size
Client D · Search Console · last 12 months

43k clicks in 12 months, with a step change in April

What the chart shows

From October 2025 to March 2026, clicks and impressions (the blue and purple lines) ran flat along the bottom of the chart. In April 2026 both stepped up sharply. Clicks have eased back from the April peak, but impressions have stayed above the old baseline since. Over 12 months: 43k clicks and 519k impressions, with an 8.3% CTR and an average position of 7.6.

  • 43k clicks
  • 519k impressions
  • 8.3% CTR
  • 7.6 avg. position
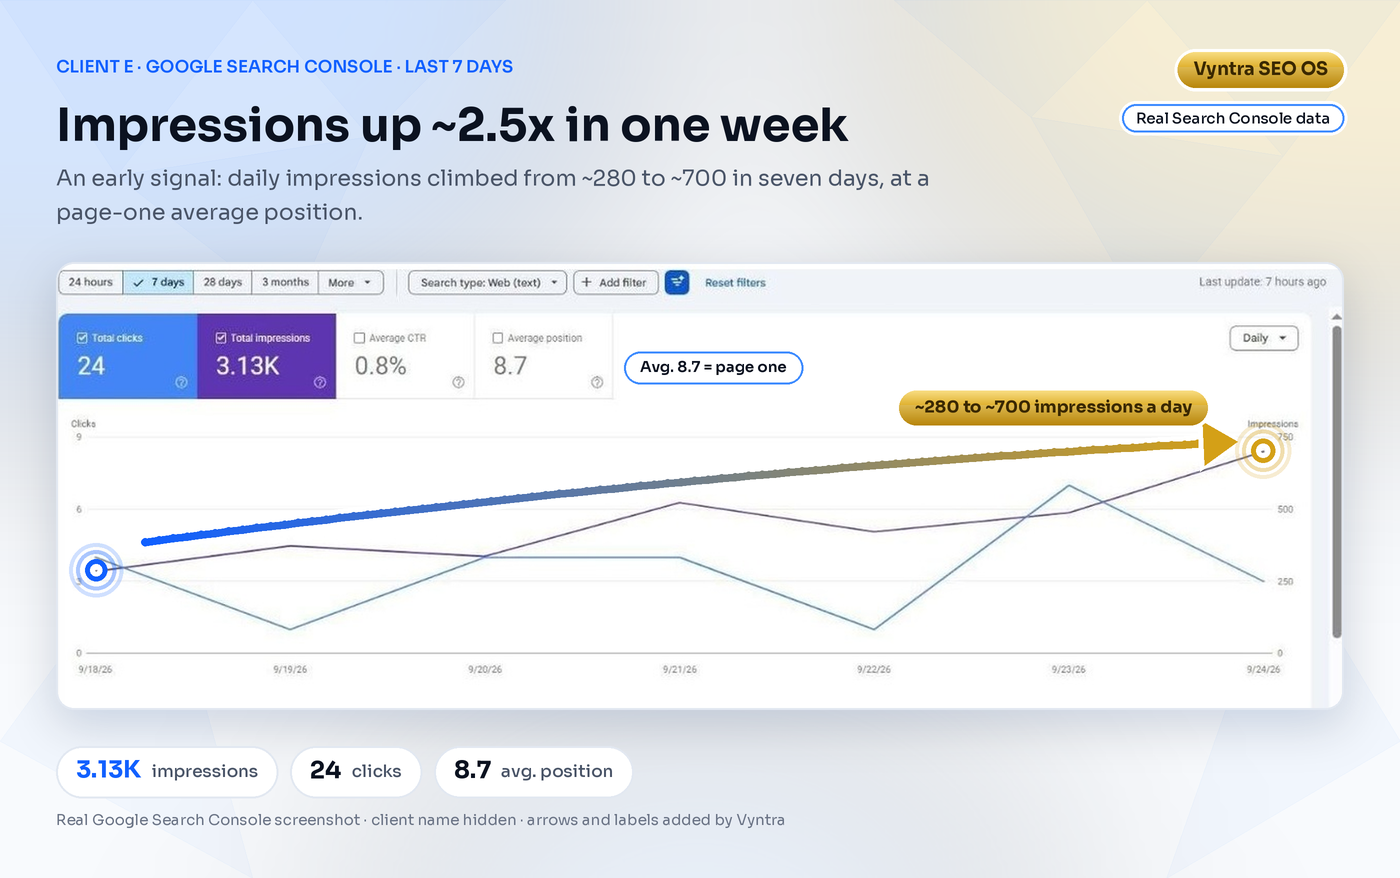
Google Search Console, 7 days: daily impressions rising from about 280 to about 700 at an average position of 8.7
Real Google Search Console screenshot · client name hidden · click to open full size
Client E · Search Console · last 7 days

Impressions up ~2.5x in one week

What the chart shows

Over seven days in September 2026, daily impressions rose from about 280 to about 700 at an average position of 8.7 (page one). Clicks are still small, 24 for the week. This is the early stage: Google starts showing the site first, and the clicks follow.

  • 3.13K impressions
  • 24 clicks
  • 8.7 avg. position
Legend

How to read these charts.

  • Blue: clicks.
  • Purple: impressions (how often Google showed the site).
  • Green: CTR.
  • Orange: average position. Search Console draws this line upside down, so higher on the chart means a better position.

Totals in each card are Google's own numbers. Per-day figures marked with ~ are read from the chart. We only added the arrows, labels and callouts; the screenshots are otherwise unedited.

What we will and won't claim

We picked charts where the change is clear. Not every site grows at this pace, and some months are flat. That's why we report every month, not only the good ones. Client names are hidden to protect their data. We never guarantee rankings: results depend on competition, your site's history, content, authority and search demand. How we measure results

FAQ

Questions people ask

Are these real results?

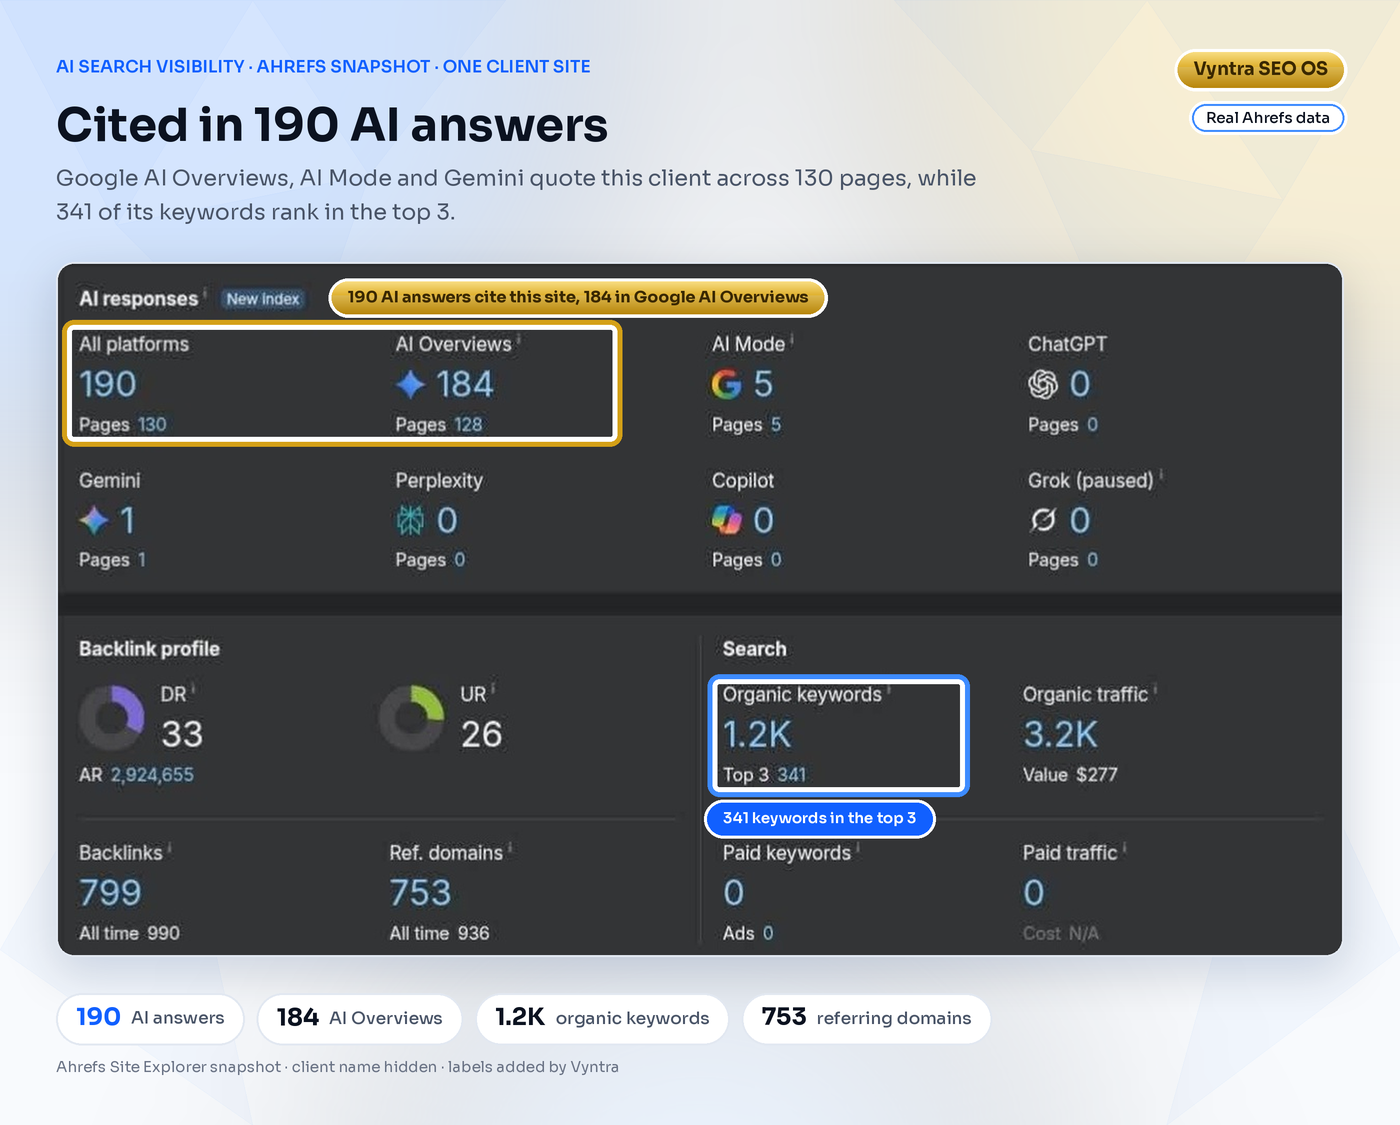
Yes. Every chart is a real screenshot from Google Search Console, or from Ahrefs for the AI citation panel. We only added arrows, labels and number callouts. The totals are Google's own numbers.

Why are the client names hidden?

A client's Search Console data belongs to them. We show the performance, not the business, so competitors can't copy their strategy.

How long until I see results like these?

Technical fixes can be picked up by Google within days to weeks. Ranking improvements for competitive keywords usually take three to six months, depending on your site history, competition, content and authority. We never guarantee rankings; we show you the work and the data every month.

Can you guarantee the same growth?

No. Results depend on competition, your site's history, content, authority and search demand. What we guarantee is the work: done every day, approved by a person, and reported every month.

Do these results include AI search?

Yes. One client's site is cited in 190 AI answers, including 184 Google AI Overviews. Visibility in AI Overviews, AI Mode and Gemini is part of how we measure SEO now.

Can I see where my own site starts?

Yes. Book a free SEO audit and we'll show you your current Search Console baseline: your own flat line or growth line.

Want a chart like these?

Start with a free SEO audit. We'll show you your Search Console baseline and what's holding it flat.